ChaN
SG12232C is a full graphics type LCD module in resolution of 122(H) x 32(V) dots. It has two Epson S1D15200 LCD controller on a board. The S1D15200 can display up to 61(H) x 32(V) dots and they drive half of the LCD panel each. SG12232C requires a 2 kHz square wave as LCD drive clock and it must be supplied during power is on or the LCD panel may be damaged due to static bias. The bus interface can select 8080 based or 6800 based. There is no 4-bit mode like HD447880, only 8-bit mode is available and it requires 14 I/O lines at least.
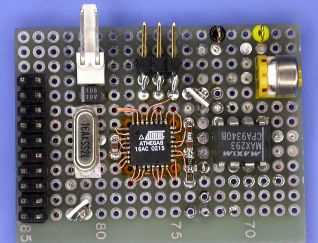
Right image shows the built circuit board and its circuit diagram. The microcontroller is an Atmel ATmega8 as usual and it digitizing the incoming audio signal and display the wave form into LCD module. There is no diffifcult to do. I used a MAX293, 8th-order elliptic filter, as an anti-alias filter. The SCF is very useful and cheap discrete LPF gets baby.
This is an evaluation use of a small graphics LCD module. Last summer, SG12232C graphic LCD module has been sold sold for 1500 Yens from Akizuki Denshi and I bought it. However I could not find good application for the LCD module and it was going to go to junk box :-) so that I tried to use the LCD module temporary.
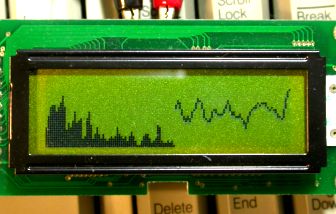
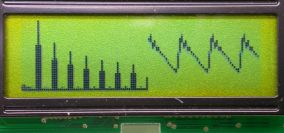
Only displaying any still image is not cool, first I tried to display an audio wave form in real-time like a digital oscilloscope, and then an FFT spectrum analysis too. The spectrum monitor seems to achived nice performance, in view of it is realized with a cheap microcontroller.
This can also be applied to radio frequency band.
Software
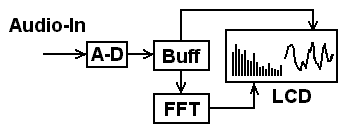
Right image shows the signal flow of internal process. The digitized data blocks are transformed in FFT and it is displayed as spectrum bars into left half (64 dots) of LCD. The wave forms are displayed into right half (58 dots) with edge aligning to still cyclic sygnals.
The FFT operations are done in 16-bit fixed-point. These 128 point FFT processes, applying window, butterfly operations and scalar output, could be executed in real-time (within 7.3 msec). This is pretty fast considering it is processed with only a cheap microcontroller. The spectrum bars are displayed in order of fundamental frequency x 0 (DC component), fundamental frequency x 1, x 2, x 3, ... from left to right. The sampling frequency is 9.6 kHz and the fundamental frequency (frequency resolution) becomes: 9.6 k / 128 = 75 Hz.
Notes
- Circuit Diagram
- Firmware for SG12232C May 29, '05
- The fixed-point FFT library for avr-gcc avrfft.zip is also available. This is written in assembler and is optimized for MegaAVRs. Mar 13, '05
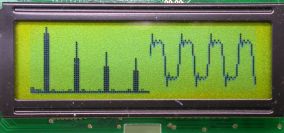
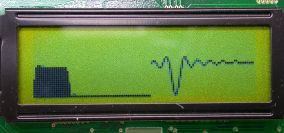
- These are some wave forms, square wave, saw wave and sin(x)/x. You will able to be find thet they are displayed just like text book.
- 128pts Video 1 (Sine, Square, Saw and sweep)
- 128pts Video 2 (Concert No.2 in G minor, P.336 "L'estate"/VIVALDI)
- 256pts Video 3 (No.27 B-dur KV595/MOZART)
- 256pts Video 4 (nostalgia/LIA)