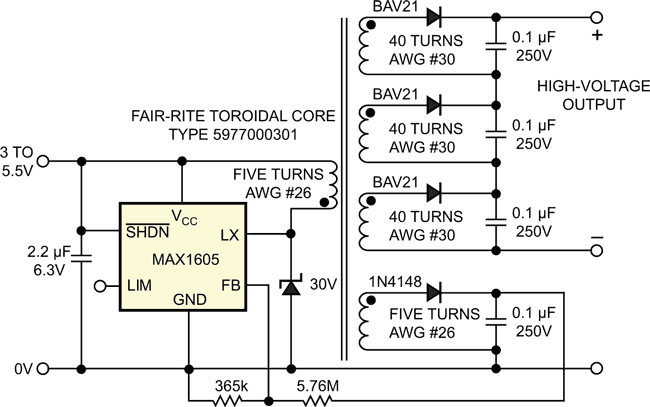
Sensors, electrostatic traps, and other applications require regulated, high-voltage power supplies that deliver modest amounts of output current. Simplicity, low quiescent current, and compactness are desirable in such supplies. The circuit of Figure 1 meets these requirements, and its magnetically isolated output allows you to configure a positive, negative, or floating output. A separate winding that generates a feedback voltage proportional to the output voltage, but lower, enables the floating output. This arrangement eliminates the need for high-value resistors in a resistive-feedback divider, which the circuit would otherwise require for direct sampling of the high-voltage output. This low-voltage divider contains resistors with much lower values, which dissipate much less power.
 |
|
| Figure 1. | Obtaining feedback from a low-voltage secondary winding, this high-voltage supply generates 500 V with low quiescent current. |
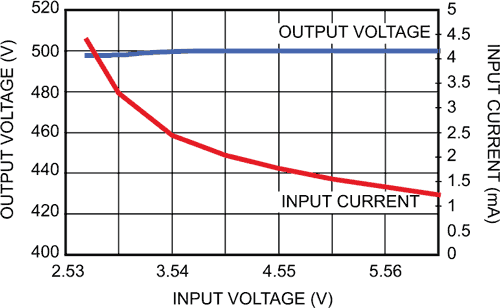
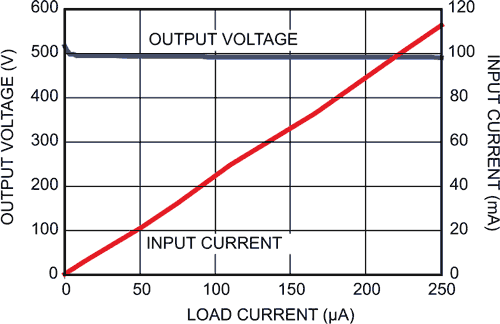
The MAX1605 IC from Maxim contains the necessary switching regulator, modulator, error amplifier, and power switches (Reference 1). It drives the primary of a toroidal transformer that includes a feedback secondary and several output windings. With the component values in the figure, the circuit can generate 500 V (figure 2 and figure 3). You can vary the output voltage ±30% by adjusting the ratio of the resistive-feedback divider. You can also increase or decrease the output voltage in steps by adding or removing the rectifier/capacitor/output-winding modules. The BAV21 is a high-voltage, low-reverse-current, general-purpose diode.
 |
|
| Figure 2. | The graph shows output voltage and input current versus input voltage. |
As with all switching converters, EMI (electromagnetic interference) and circuit parasitics can present problems. The circuit needs careful PCB (printed-circuit-board) layout, along with filtering, decoupling, and shielding. The high-voltage output has approximately 1% ripple. You can add an RC or an LC filter in series with the output to achieve lower output ripple.
 |
|
| Figure 3. | The graph shows output voltage and input current versus load current. |
Reference