EDN
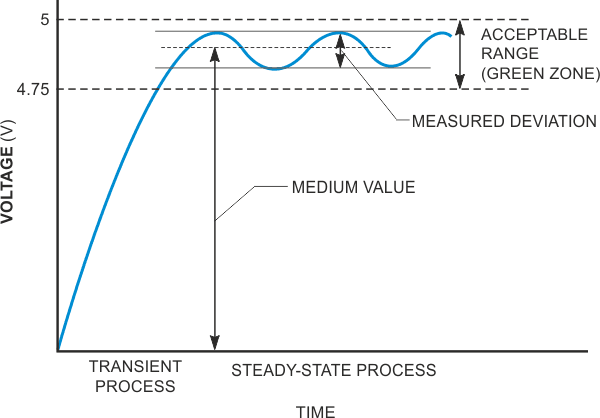
Test equipment for a production line should be user-friendly (read “idiot-proof”) and should offer minimal test time. In many cases, the test fixture must give an operator only one answer: pass or fail. Usually, two indicators assume this role: green for pass and red for fail. In most applications, a sensor transforms the tested parameter to a voltage; the test fixture must measure this voltage and display the result. Sometimes, an operator needs to observe the dynamics of the tested parameter to verify that the results are inside the permitted “green zone.” For example, when evaluating a regulated system's behavior, the operator is often interested in measuring the parameter's deviation and estimating its average value after the process reaches steady state (Figure 1). In this situation, using an analog meter with marked red and green zones is preferable to using a digital or bar-graph LED display.
 |
||
| Figure 1. | It’s desirable to observe deviations in values inside the acceptable “green zone.” |
|
 |
||
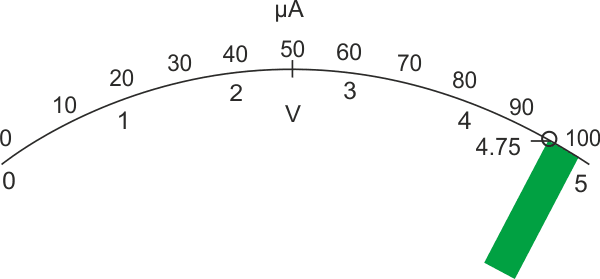
| Figure 2. | It’s difficult to discern deviations from the norm when the green zone represents only 10% of full-scale. |
|
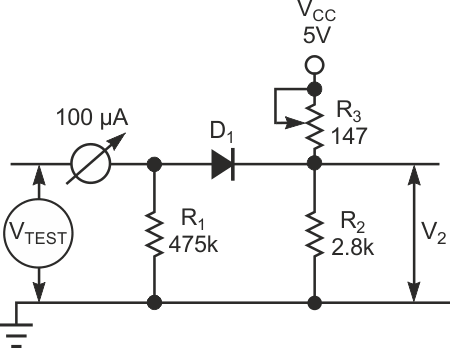
Assume that the range of the tested voltage is 4.75 to 5 V. To make a voltmeter with maximum 5 V reading by using a 100-µA dc meter, you would use a series resistor of 50 kΩ. The meter scale is linear, and the tested voltage zone represents only 5% of full-scale (Figure 2). It is difficult for an operator to observe the meter reading inside such a narrow zone. It would be desirable to expand the test zone to, say, 90% of full-scale (Figure 3). The circuit in Figure 4 does just that. When the tested voltage, VTEST, is lower than the threshold voltage, V2, the diode, D1 does not conduct, and the voltmeter comprises the microammeter and resistor, R1. When the tested voltage surpasses the threshold V2, the diode conducts, and resistor R2 connects in parallel with R1. The voltmeter's impedance decreases, thereby expanding the measurement scale. You can calculate the values of resistors R1, R2, and R3 as follows:
 |
||
| Figure 3. | Expanding the green zone to 90% of full-scale makes readings much easier. | |
 |
||
| Figure 4. | This simple circuit expands the acceptable test results to 90% of full-scale. |
|
The voltage at the beginning of the tested zone, 4.75 V, should consume 10% of the scale, with a corresponding current of 10 µA. Hence, neglecting the internal meter impedance, R1 equates to 4.75 V/10 µA, or 475 kΩ.
After the measured voltage exceeds the threshold level, 4.75 V, the voltmeter impedance equates to

Hence,

and
