EDN
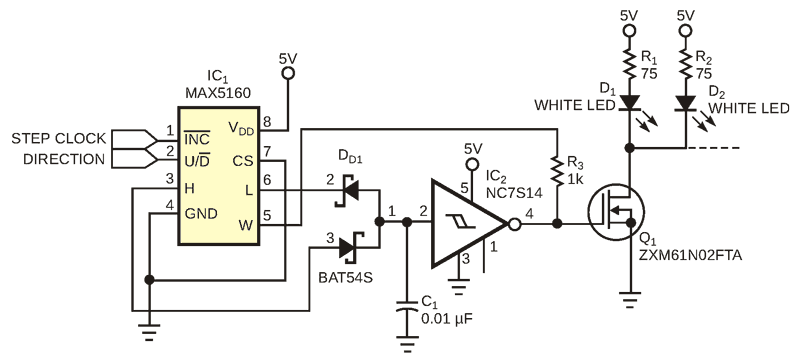
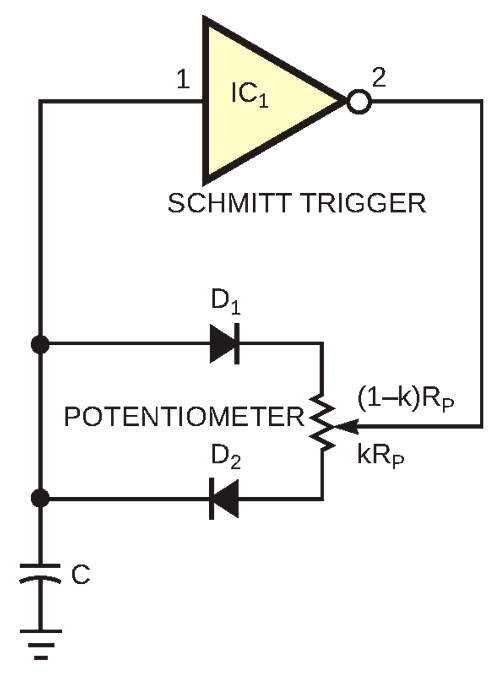
The circuit in Figure 1 provides 32 steps of brightness control – from 0 to 100% – for a backlight or instrument panel, using just two general-purpose-microprocessor signals. In addition, the circuit requires little board space, because it uses only three SOT-23s and one µMax package. Although Figure 1 shows the circuit driving white LEDs, the load could also be a dc motor or an incandescent lamp. The basis of the circuit is a modified Schmitt-trigger relaxation oscillator (Figure 2).
 |
||
| Figure 1. | By controlling the duty cycle of a Schmitt trigger, you obtain 32 steps of brightness in an LED display. | |
 |
||
| Figure 2. | The MAX5160 digital potentiometer controls the duty cycle of the Schmitt trigger. |
|
The output of IC1 is high when

where k is the wiper position, VCC is the supply voltage, VD is the diode voltage, and VN and VP are the threshold voltages of the Schmitt trigger. The output of IC1 is low when

The period, T, and duty cycle, DC, are

and

Initial inspection of the foregoing equations may make the substitutions to solve for the duty cycle appear to be a tedious, algebraic exercise. But, when you substitute VCC, VD, VN, and VP into the two logarithmic terms, their results are close in value. So, you can simplify the expanded solution to the duty-cycle equation to

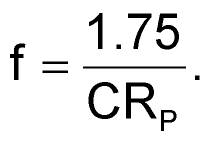
Based on the above considerations, you can see that the duty cycle of the circuit is not only linear, but also independent of the selected components. The component selection affects only the center frequency of oscillation. An approximate equation for the operating frequency is
 |
||
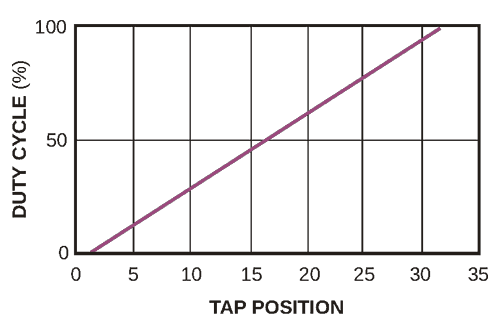
| Figure 3. | The duty cycle of the Schmitt trigger is a linear function of the potentiometer’s tap position. |
|
 |
||
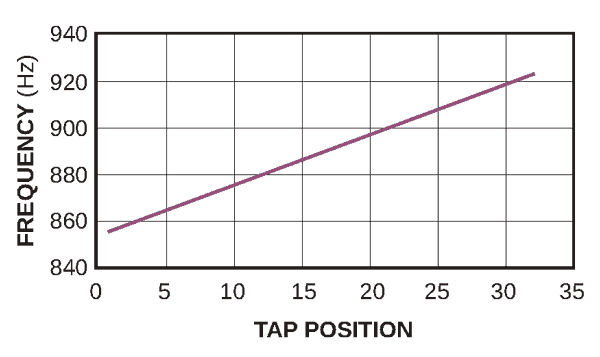
| Figure 4. | Frequency also varies with the tap position, but with no effect on performance. |
|
This circuit uses a MAX5160 digital potentiometer that has a full-scale resistance of 200 kΩ in combination with a 10-nF capacitor. This combination results in an operating frequency of approximately 875 Hz. Note that slight mismatches of the two logarithmic terms cause the frequency to vary slightly as you adjust the duty cycle. Figure 3 shows a plot of duty cycle versus the potentiometer's tap position; Figure 4 shows the variation in the oscillation frequency with tap position.