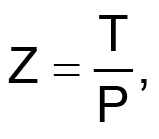
All thermal anemometers work by inferring air speed from measurements of thermal impedance (Z) between a heated sensor and the surrounding air:
 |
(1) |
where P is the power dissipated by the sensor and T is the temperature difference between the sensor and ambient.
There are two basic schemes for doing this.
- Hold P constant and measure the resulting temperature difference T
- Hold T constant and measure the power P required to do it
An example of the constant power type can be found in “Nonlinearities of Darlington airflow sensor and VFC compensate each other” (Ref. 1)…
…and examples of the constant temperature type can be found in “Linearized portable anemometer with thermostated Darlington pair” (Ref. 2)…
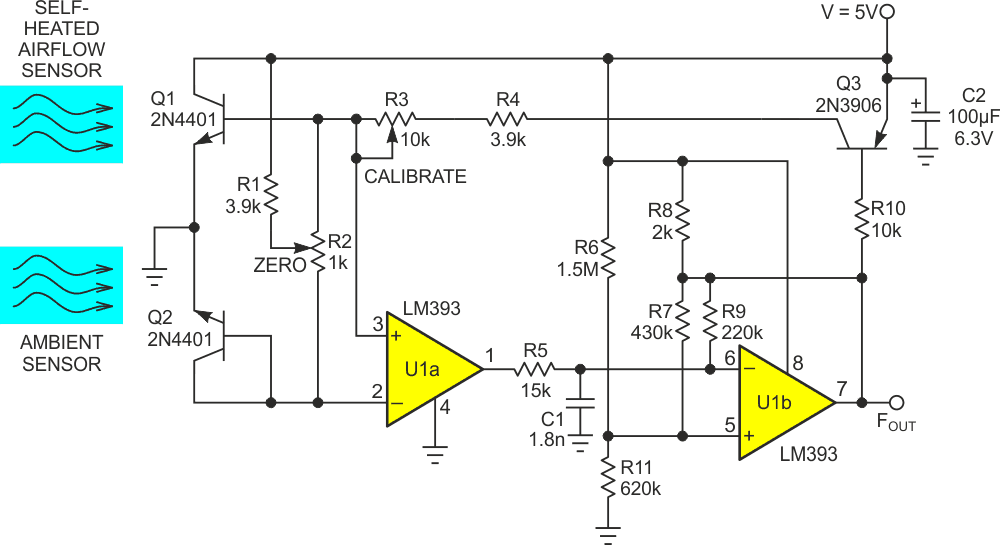
…and in Figure 1.
 |
|
| Figure 1. | Constant-temperature anemometer with direct power-to-frequency conversion. |
Figure 1’s anemometer is unusual because it melds the sensor transistor into a direct PFC (Power to Frequency Converter) loop.
To understand how the Figure 1 circuit works, consider the case of zero airflow. You use ZERO trimmer R2 to set the quiescent base-bias currents for Q1 and ambient reference Q2. With the proper adjustment, Q1’s temperature rise (~50 °C) in still air, caused by collector power dissipation, reduces Q1’s VBE (by ~2 mV/°C) to equal or slightly below Q2’s. The noninverting input of comparator U1a is then slightly less positive than the inverting input. The output therefore switches low, holding C1 discharged and resetting multivibrator U1b, whose output goes high.
This condition does two things: It forces FOUT = 0 and holds Q3 off.
Now let’s blow some air at Q1. The resulting increase in cooling tends to reduce Q1’s temperature, causing its VBE to increase relative to that of Q2. This makes the comparison between U1a’s inputs reverse, releasing the reset on C1. C1 then charges through R9 and turns on Q3, driving a t = 700-µsec pulse to Q1’s base through CALIBRATE trimmer R3.
The resultant pulse of collector current forced in Q1 can be seen in Equation 2 (where hFE = Q1 current gain and RCAL = R3 + R4):
 |
(2) |
This deposits a quantum of heat on Q1’s junction:
 |
(3) |
which tends to return Q1 ‘s temperature to a value warm enough to restore the original zero-flow voltage balance with ambient-sensor Q2. Until Q1 achieves that temperature, U1b continues to oscillate, cycle Q3 on, and pump heat into Q1.
Thus, a feedback loop is established that acts to maintain a constant temperature differential between Q1 and Q2. The average frequency appearing at U1b’s output is therefore proportional to the extra power required to heat Q1. The maximum output frequency for the circuit values in Figure 1 is 1 kHz. Appropriate adjustment of R3 establishes almost any desired full-scale flow. Temperature tracking between the Q1 and Q2 VBE voltages provides good compensation for changes in ambient temperature.
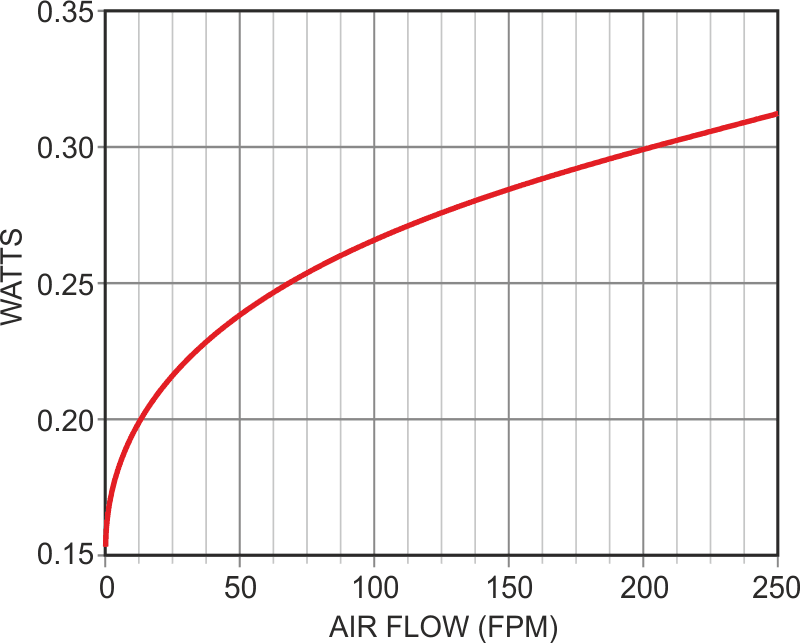
The direct connection of Q1 to the power rail results in good efficiency (>90%) power utilization, so while power draw is (by definition!) dependent on airflow, as shown in Figure 2, it’s typically modest: 200 to 350 mW.
 |
|
| Figure 2. | Q1 power draw versus air flow is typically a modest 200 to 350 mW. |
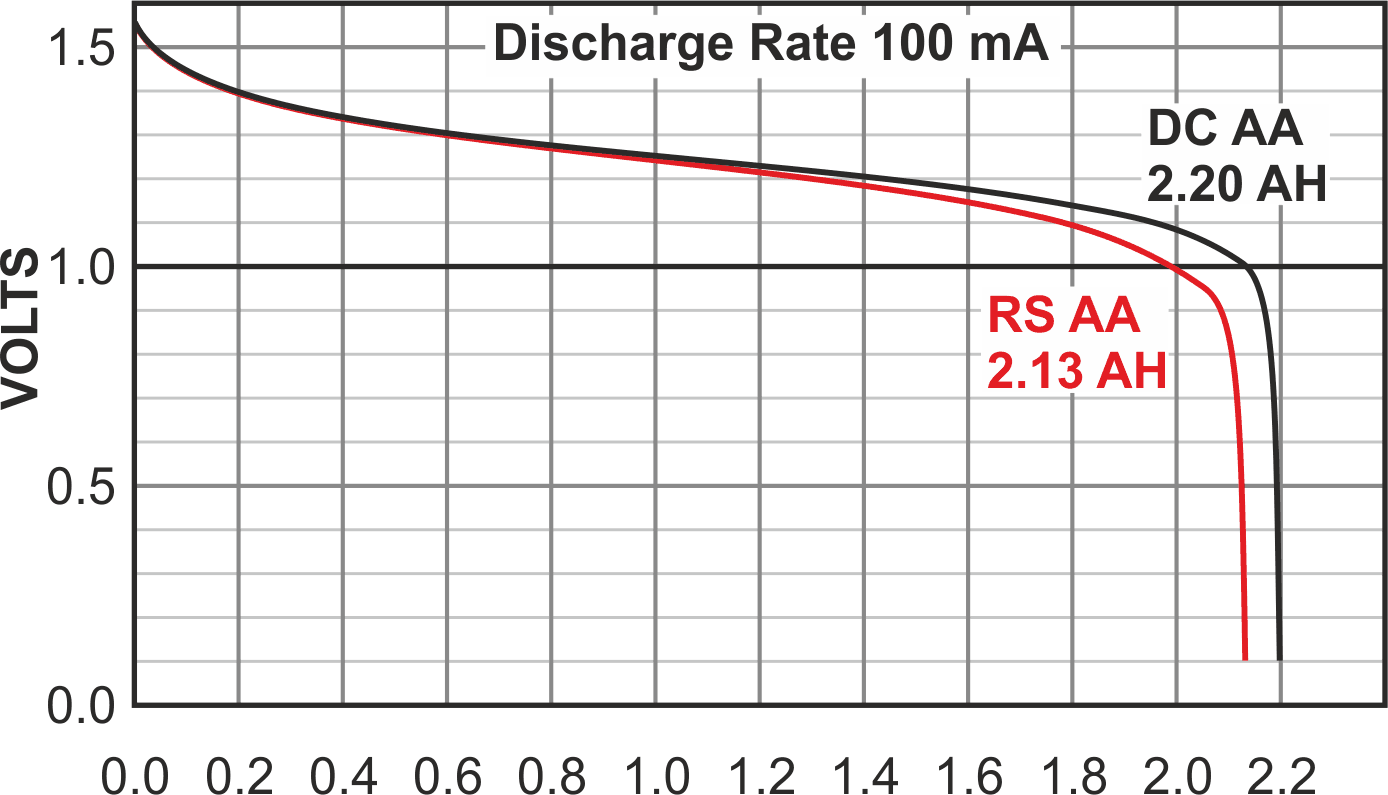
In fact, power consumption is low enough that portable battery operation, with a cheap multimeter for frequency readout, looked attractive. An inexpensive stack of four AA alkaline batteries promised tens of hours of continuous operation which could equate to hundreds of air velocity readings. However, as shown in Figure 3, direct battery power of Figure 1 wouldn’t work very well, due to the ±20% roll-off of battery voltage during discharge.
 |
|
| Figure 3. | Typical AA cell discharge droop curves with an undesirable ±20% roll- off of battery voltage during discharge, resulting in a degradation of anemometer calibration accuracy. |
The resulting degradation of anemometer calibration accuracy would be extreme, especially considering Equation 4:
 |
(4) |
that shows the square-law dependence of Q1 heating on supply voltage!
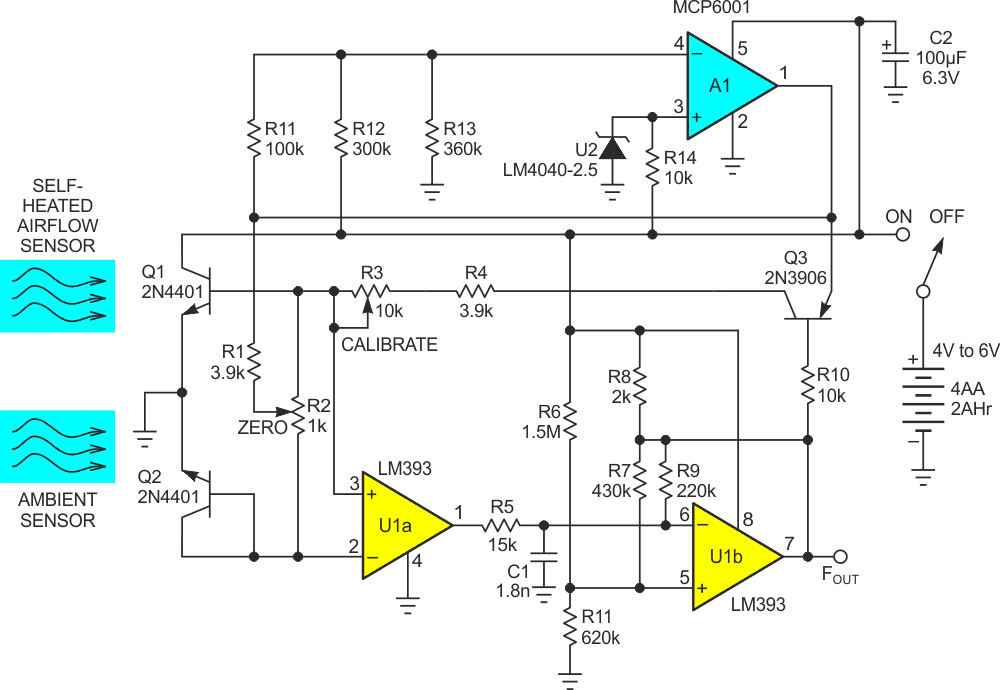
Meanwhile, the seemingly obvious remedy of supply voltage regulation wouldn’t be very attractive either, due to the resulting impact on complexity, efficiency, and cost. Fortunately, Figure 4 shows an alternative simple, cheap, and efficient solution: base bias compensation.
 |
|
| Figure 4. | Figure 1’s anemometer modified with U2, A1, and R11 – 14 to servo Q1 and Q2 bias currents to (mostly) null the effects of battery voltage droop. |
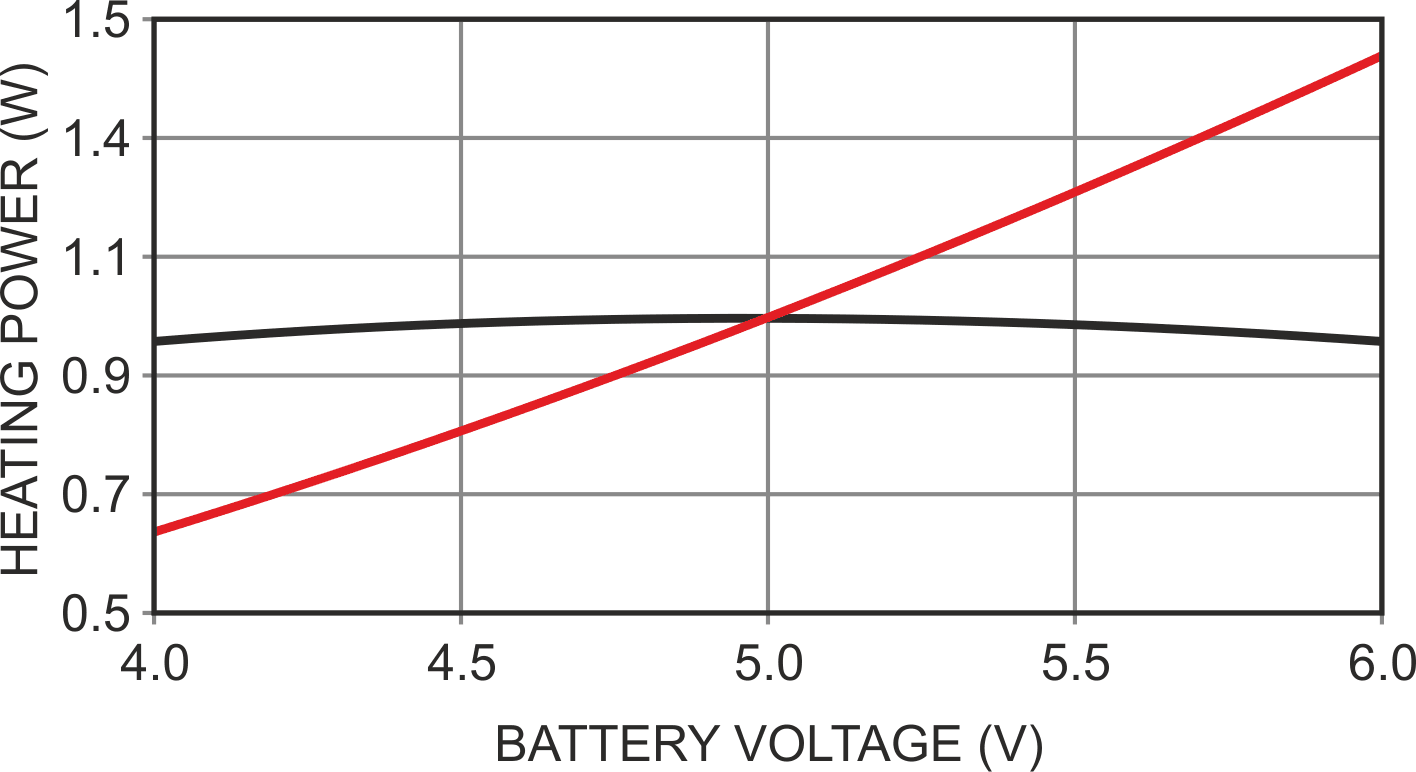
Figure 5 shows the resulting compensated power curve (black) versus what would result without it (red): better than an order of magnitude improvement!
Still not perfect, but arguably good enough.
 |
|
| Figure 5. | Nulled (black) and uncompensated (red) Q1 heating versus battery voltage droop (5 ±1 volts). |
References
- Woodward, Stephen. "Nonlinearities of Darlington airflow sensor and VFC compensate each other."
- Woodward, Stephen. "Linearized portable anemometer with thermostated Darlington pair."