Most simple circuits you'll find for measuring reactive components cover only a limited range of component values. Here's a circuit built from a handful of inexpensive parts that will let you measure values of both capacitors and inductors over seven orders of magnitude. Capacitors from about 1 pF to 10 μF and inductors from about 200 nH to 4 H can be characterized.
To cover this wide range, however, you'll need to give up a little convenience, as you find the DUT’s value by adjusting a variable resistor and looking up a corresponding capacitance or inductance value on a calibration plot, rather than by a direct reading.
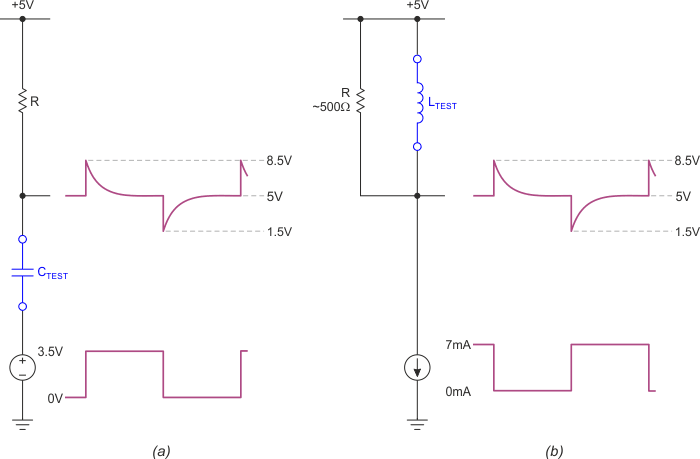
To understand circuit operation, start with the basics shown in Figure 1. In part (a), a square wave voltage source drives the bottom terminal of the capacitor under test. The voltage at the top terminal is a series of exponentially decaying positive- and negative-going pulses above and below the +5 V rail. The time constant of the decay is of course the product R·CTEST. Similarly, in part (b), a square wave current source feeds the test inductor, resulting in similar transients above and below the +5 V rail, with the decay time constant equaling LTEST/R. The portion of each half period of the square wave that is occupied by the exponential decay process depends on the relationship between the time constant and the oscillation period.
 |
|
| Figure 1. | Basic scheme for measuring capacitors (a) and inductors (b) with variable frequency square waves. |
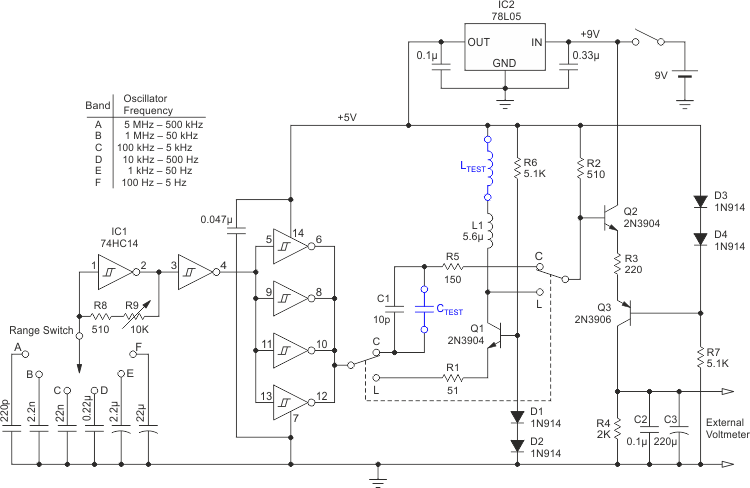
Now consider the complete schematic in Figure 2. A square wave is generated by IC1 wired as a simple Schmitt trigger RC oscillator and output buffer. The frequency is set by the variable resistor R9 and ranges A through F of six decade capacitors. R9 should have a linear taper and be wired so that the oscillator period increases with clockwise shaft rotation.
A DPDT switch selects between capacitor and inductor measurement modes. Following the basic scheme of Figure 1, either the voltage directly from the IC1 outputs or the current generated by Q1 is fed to the capacitor or inductor under test, respectively. The 510 Ω resistor R2 functions as the decay resistance R of Figure 1 in 'L' mode, and the series connection of R5 and R2 forms the decay resistance in 'C' mode. (R5 is present to keep the voltage excursions at the base of Q2 low enough to avoid saturation.) Bias resistor R7 and diodes D3 and D4 hold the base of Q3 at about 2VBE below the +5 V rail. At this bias point, Q2, R3, and Q3 form a rectifying transconductance block with a small idling current that is sensitive only to the positive going transients above the +5 V rail from the component under test. The pulses of collector current from Q3 are dropped across R4, and the resulting voltage, averaged by C2 and C3, is measured by an external voltmeter.
 |
|
| Figure 2. | Complete schematic of C and L meter. |
Transients with an exponential decay that extend over a particular portion of the square wave period will produce a corresponding output DC voltage, but the exact nonlinear relationship between the duty cycle and the output voltage is not important. Since Q2 and Q3 are in high speed common collector and common base configurations respectively, the response of this circuit is fast, and the duty cycle measurement is approximately independent of frequency.
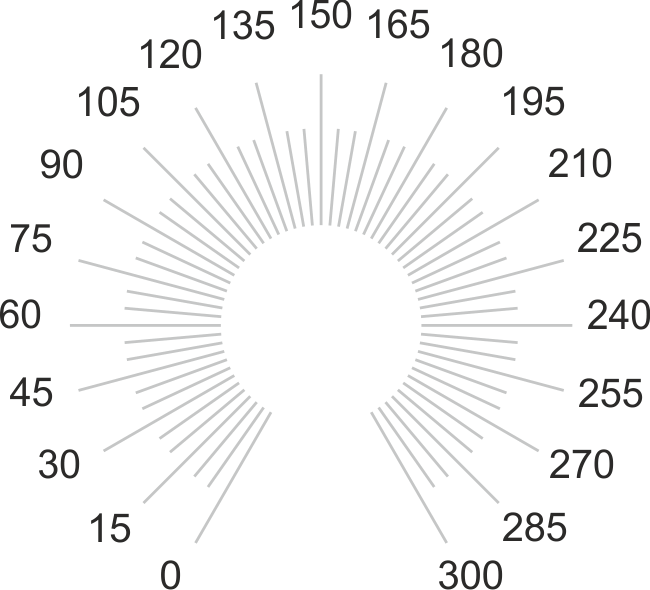
By tuning the oscillation period with R9 so that the output voltage ends up at some fixed reference level, for instance, 1.00 V, you will be keeping a fixed relationship between the exponential time constant and the period. Since the decay time constant varies linearly with the reactive test component value, the measured capacitance or inductance values will turn out to be linear with respect to the oscillator period, and therefore linear with respect to the shaft angle of R9. By applying a suitable dial marking on R9 and calibrating the circuit with a few known capacitor and inductor values, calibration charts can be plotted that will allow you to determine any test component value. Figure 3 shows the dial marking graphic for R9 that is included in the downloadable example calibration package.
 |
|
| Figure 3. | Example dial marking graphic for R9. |
The oscillator range switch will cover six decades, although the minimum period is limited by the propagation delay of IC1. This will let you cover the top six orders of magnitude of capacitance or inductance, from low to high values for ranges A through F. Clip the test component into the circuit, find the settings of the range switch and the variable resistor that give 1.00 V at the output, and look up the value on the plot corresponding to each range. Range A will let you measure down to about 10 pF or 2 μH, and range F up to about 10 μF or 4 H.
To extend measurements down to about 1 pF and 200 nH, you can use an additional trick. The small offset components C1 and L1 are always contributing a minimum time constant in either 'C' or 'L' mode, and by comparing the change in the voltage read by the external voltmeter when a test device is added to these small offsets, an additional calibration chart can be plotted for the very lowest range of values.
The measurement technique for this lowest range is to leave the component under test out of the circuit at first, by either leaving the capacitor test clips open or the inductor test clips shorted. Then set the oscillator to range 'A' and adjust the oscillator period with R9 until you see the target voltage of 1 V with only the offset component in the circuit. Finally, insert the test component in the circuit and observe the change in the voltmeter reading. Look up this offset voltage on the calibration chart to determine the small component values.
The download below contains an example dial scale, some sample calibration plots, and the gnuplot data and script files used to generate them. Within a least squares fit that removes the typical ±10% variation in reactive components, you can see the linearity of the measurements with respect to dial reading over all the ranges. Your calibration will probably vary with different parts, but you can edit the data files and generate your own plots.
