While refurbishing an ageing audio mixer, I decided that the level meters needed special attention. Their rather horrible 100 µA edgewise movements had VU-type scales, the drive electronics being just a diode (germanium?) and a resistor. Something more like a PPM, with a logarithmic (or linear-in-dBs) scale and better dynamics, was needed. This (Ref. 1) is a good summary of the history and specifications of both PPMs and VU meters.
It occurred to me that since both peak detection and log conversion imply the use of diodes, it might be possible to combine those functions, at least partially.
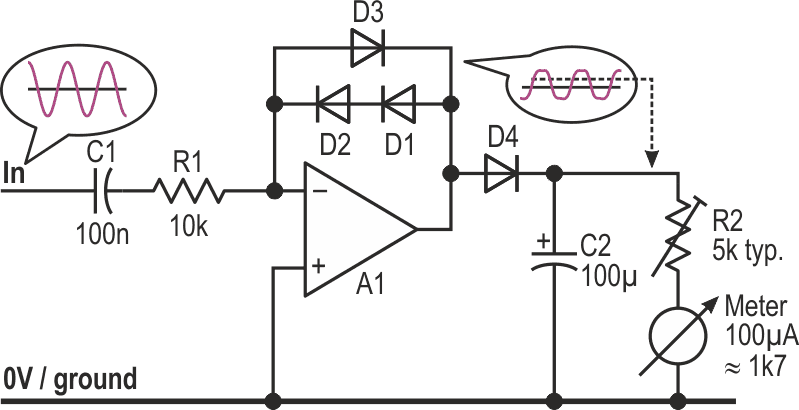
Log conversion normally uses either a transistor in a feedback loop round an op-amp or a complex ladder using resistors and semiconductors. The first approach requires a special PTC resistor for temperature compensation and is very slow with low input levels; the second usually has a plethora of trimpots and is un-compensated. This new approach, sketched in Figure 1, shows the first pass at the idea, and avoids those disadvantages.
 |
|
| Figure 1. | This basic peak log detector shows the principals involved and helps to highlight the problems. (Assume split, non-critical supply rails.) |
As with all virtual-earth circuits, the input resistor feeds current into the summing point – the op-amp’s inverting input – which is balanced by current driven through the diodes by the op-amp’s output. Because the forward voltage across a diode (VF) is proportional to the logarithm of the current flowing through it (as described here (Ref. 2)), the op-amp’s output voltage now represents the log of the input signal. Positive input half-cycles cause it to clamp low at VF, which we ignore, as this is a half-wave design; for negative ones, it swings high by 2VF.
Driving that 2VF through another diode into the capacitor charges the latter to VF, losing a diode-drops’-worth in the process. (No, the VFs don’t match exactly, except momentarily, but no matter.) The meter now shows the log of negative-input half-cycle peaks, the needle falling back as the capacitor discharges through the meter.
As it stands, it works, with a very reasonable span of around 50 dB. Now for the problems:
- The integration, or attack time, is slow at ~70 ms to within 2 dB of the final reading.
- The return or decay time is rather fast, about a second for the full scale, and is exponential rather than linear.
- It’s too temperature-sensitive, the indication changing by ~5 dB over a 20 °C range.
While this isn’t bad for a basic, log-scaled VU-ish meter, something snappier would be good: time for the second pass.
 |
|
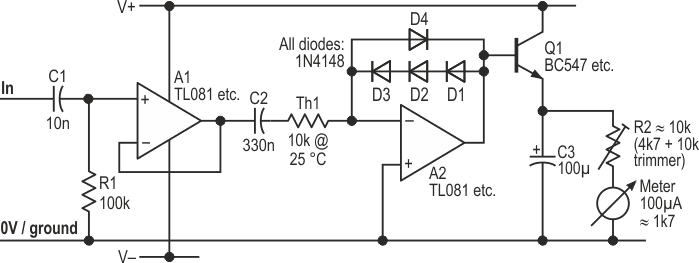
| Figure 2. | This upgraded circuit has a faster response and much better temperature stability. |
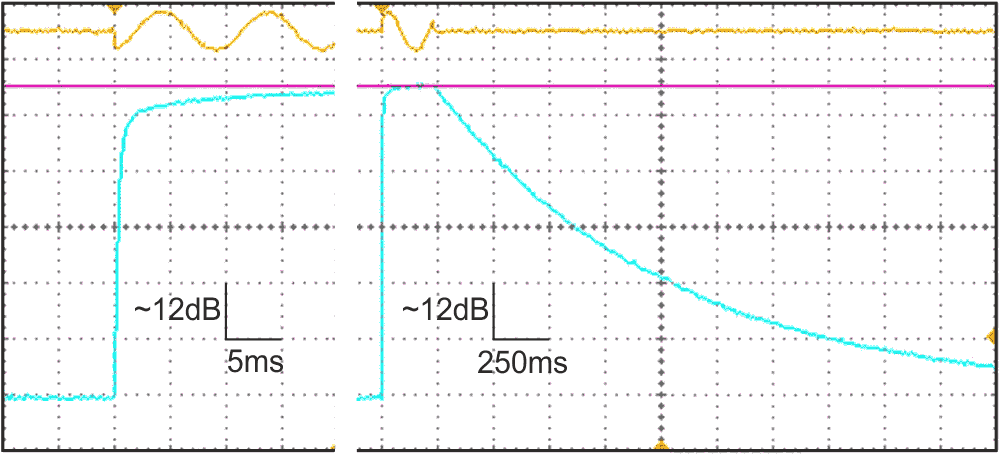
A1 buffers the input signal to avoid any significant load of the source (Figure 2). C1 and R1 roll off bass components (–3 dB at ~159 Hz) to avoid spurii from rumbling vinyl and woodling cassette tapes. Drive into A2 is now via thermistor Th1 (a common 10k part, with a β-value of 3977), which largely compensates for thermal effects. C2 blocks any offset from A1, if used. (Omit the buffer stage if you choose, but the input impedance and LF breakpoint will then vary with temperature, so then choose C2 with care.) Three diodes in the forward chain give a higher output and a greater span. A2 now feeds transistor Q1, which subtracts its own VBE from the diodes’ signal while emitter-following that into C3, thus decreasing the attack time. R2 can now be higher, increasing the decay time. Figure 3 shows a composite plot of the actual electronic response times; the meter’s dynamics will affect what the user sees.
The attack time is now in line with the professional spec, and largely independent of the input level. While the decay time is OK in practice, it is exponential rather than linear.
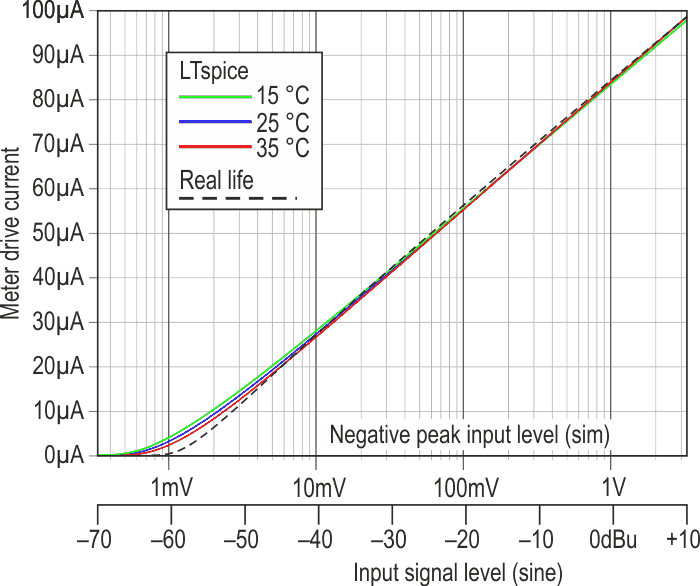
The response to varying input levels is shown in Figure 4. I chose to use a full-scale reading of +10 dBu, the normal operating level being around –10 dBu with clipping starting at ~+16 dBu. For lower maximum readings, use a higher value for Th1 or just decrease R2, though the decay time will then be faster unless you also increase C3, impacting the attack time.
 |
|
| Figure 4. | The simulated and actual response curves are combined here, showing good conformance to a log law with adequate temperature stability. |
The simulation used a negative-going ramp (coupling capacitors “shorted”) while the live curve was for sine waves, with Th1 replaced by a 1% 10k resistor and R2 adjusted to give 100 µA drive for +10 dBu (6.6 Vpk-pk) input. I used LTspice here to verify the diodes’ performance and to experiment with the temperature compensation. The meter coil has its own tempco of +3930 ppm/°C, which is also simulated here though it makes little practical difference. Just as well: might be tricky to keep it isothermal with the other temperature-sensitive stuff.
Simple though this circuit is, it works well and looks good in operation. (A variant has also proved useful in a fibre-optic power meter.) The original meters, rebuilt as in Figure 2, have been giving good service for a while now, so this is a plug-in breadboard rehash using a spare, similar, meter movement, with extra ’scoping and simulation. It’s possible to take this basic idea further, with still-faster attack, linear decay, adjustable span, better temperature compensation, and even full-wave detection – but that’s another story, and another DI.
